


Immobilien News
Experts: 2024 Home Prices Won’t DeclineDespite predictions housing prices would come down, values keep rising in 2024. The reason? The tight inventory. WASHINGTON – Much to the chagrin of would-be homebuyers, property prices just keep rising. It seems nothing — not even the highest mortgage rates in nearly 23 years — can stop the continued climb of home prices. Prices increased once again in December, according to the National Association of Realtors (NAR), which reports that median existing-home prices were up 4.4% over last year — the sixth month in a row of year-over-year jumps. In another reflection of ongoing increases, the latest S&P CoreLogic Case-Shiller home price index showed a 4.8% jump in October that represented the ninth month in a row of gains. So much for the idea that a “housing recession” would reverse some of the outsized price gains in homes. The U.S. housing market had finally started slowing in late 2022, and home prices seemed poised for a correction. But a strange thing happened on the way to the housing market crash: Home values started rising again. NAR data shows that median sale prices of existing homes are near record highs. December 2023’s median of $382,600 is off the all-time-high of $413,800, but not by much, especially for a typically quiet time of year. (Seasonal fluctuations in home prices make June the highest priced month of most years — the all-time-high was reached in June 2022.) “The housing recession is essentially over,” says Lawrence Yun, NAR’s chief economist. Home values held steady even as mortgage rates soared to 8% in October 2023, reaching their highest levels in more than 23 years. (They have since dipped back down, falling below 7% in recent weeks.) The main culprit is a lack of housing supply. Inventories remain frustratingly tight, with NAR’s December data showing only a 3.2-month supply. "You’re not going to see house prices decline," says Rick Arvielo, head of mortgage firm New American Funding. "There’s just not enough inventory." Skylar Olsen, chief economist at Zillow, agrees about the supply-and-demand imbalance. Her latest forecast says home prices will keep rising into 2024 — welcome news for sellers but not so great for first-time buyers struggling to become homeowners. “We’re not in that space where things are suddenly going to be more affordable,” Olsen says. In fact, the trend is quite the opposite. According to Realtor.com’s December 2023 Housing Market Trends Report, high mortgage rates have increased the monthly cost of financing the typical home (after a 20% down payment) by 6.1% since last year. That equates to $123 more in monthly payments than a buyer last December would have seen. Mortgage rates fell sharply in late December, a move that boosted affordability. However, lower mortgage rates also are pulling more buyers into the market. “The potential for a decline in mortgage rates intersects with the prime homebuying time of the year — if you can find one to buy, that is,” says Greg McBride, Bankrate’s chief financial analyst. Taking all this into account, housing economists and analysts agree that any market correction is likely to be a modest one. No one expects price drops on the scale of the declines experienced during the Great Recession. Is a crash coming? No. There are still more buyers than sellers, and that means a meaningful price decline can’t happen: “There’s just generally not enough supply,” says Mark Fleming, chief economist at title insurer First American Financial Corporation. “There are more people than housing inventory. It’s Econ 101.” Dave Liniger, the founder of real estate brokerage RE/MAX, says the sharp rise in mortgage rates has skewed the market. Many would-be buyers have been waiting for rates to drop — but if mortgage rates do decline, it could send new buyers flooding into the market, pushing up home prices. © Copyright 2024, Conley Publishing Group Ltd. All rights reserved. New Home Sales Surge in DecemberSales on new construction single-family homes increased 8% in December and 4.4% year over year across the U.S. In the South, new home sales increased by 5.2%. WASHINGTON – Sales of newly built single-family homes surged in December, exceeding expectations fueled by lower mortgage rates and an inventory shortage. New home purchases increased by 8.0% to a 664,000 seasonally adjusted annual rate after an upward revision to November’s figures, according to newly released data by the U.S. Department of Housing and Urban Development and the U.S. Census Bureau. The pace of new home sales in December is up 4.4% year to year. An estimated 668,000 new homes were sold in 2023, up 4.2% from the 2022 figure of 641,000. Regionally, on a year-to-year basis, new home sales are up in all four regions: up 3.5% in the Northeast, 3.6% in the Midwest, 5.2% in the South and 2.1% in the West. “The solid new home sales rate in December was fueled by a lack of existing inventory in the resale market and declining interest rates,” said Alicia Huey, chairman of the National Association of Home Builders (NAHB) and a custom home builder from Birmingham, Ala. “The rise in sales also coincides with our latest builder surveys, which show a marked increase in future sales expectations because of falling mortgage rates.” A new home sale occurs when a sales contract is signed or a deposit is accepted. The home can be in any stage of construction: not yet started, under construction or completed. In addition to adjusting for seasonal effects, the December reading of 664,000 units is the number of homes that would sell if this pace continued for the next 12 months. New single-family home inventory in December remained elevated at a level of 453,000, up 0.4% compared to a year earlier. This represents an 8.2 months’ supply at the current building pace. A measure near a 6 months’ supply is considered balanced. Completed, ready-to-occupy inventory, 88,000 homes in December, is up 22.2% from a year ago. However, that inventory type remains just 19% of total inventory. The median new home sale price in December was $413,200, edging down 3.0% from November, and down 13.8% compared to a year ago. “New home sales ended the year on a high note thanks largely to falling interest rates and a decline in existing home sales,” said Danushka Nanayakkara-Skillington, NAHB’s assistant vice president for forecasting and analysis. “And while moderating interest rates are a promising sign for new home sales in the year ahead, long-term issues such as a shortage of buildable lots, a lack of skilled labor and excessive regulations will continue to pose challenges for builders.” © 2024 Florida Realtors® Fannie Mae Sees Positive Home Price Growth Through 2025Experts said the growth is encouraging for homebuyers but other factors, including AI and green energy, will play a role. WASHINGTON – A panel of national housing experts expect U.S. home prices to continue to grow through 2025, denoting “an encouraging consensus” as the new year ticks closer, a new Fannie Mae survey showed. Fannie Mae’s Home Price Expectations Home Survey (HPES), conducted by Pulsenomics, found an annual national home price growth of 2.4% in 2024 and 2.7% in 2025. The HPES polls more than 100 experts across the housing and mortgage sectors and academia for forecasts of national home price percentage changes in each of the coming five calendar years, as measured by the Fannie Mae Home Price Index (FNM-HPI). “Panel-wide, the average expected home price growth rate for 2023 jumped to 5.9%, which is a significant increase from the 3.3% level recorded in the previous survey conducted by Pulsenomics,” Terry Loebs, founder of Pulsenomics, said. “However, a large majority of the surveyed experts do not foresee this momentum carrying over into 2024 – an encouraging consensus for aspiring homebuyers as we approach the new year.” Freddie Mac SVP and Chief Economist Doug Duncan shared insights into the survey’s findings: “The survey panelists expect home price growth to decelerate in the coming years, following a 2023 price growth that proved more resilient than many anticipated. Some, including us, had expected the rapid and significant rise in mortgage rates in 2023 to have dampened purchase demand further than it has, putting more downward pressure on home prices this past year than what appears to have occurred. Looking beyond the recent volatility in mortgage rates, panelists expect future rates to decline meaningfully from the recent highs of 8 percent. This would obviously provide improved affordability for potential homebuyers, although anyone expecting the return of the extremely low rate environment from 2020 to 2022 will likely be disappointed. The panelists also revealed that they anticipate other factors will impact long-term interest rates, including demographic trends, expanding fiscal deficits, the evolution of artificial intelligence, and the green energy transition.” © 2023 Florida Realtors® New Home Sales Weaken in OctoberSales were down 5.6% month-to-month, but they’re up 17.7% year-to-year and up 4.6% so far in 2023. About 30% of all Oct. home sales were new construction. WASHINGTON – Sales of newly built, single-family homes in October fell 5.6% compared to September, to a 679,000 seasonally adjusted annual rate, after “a notable downward revision in September.” However, the pace of new home sales in October was up 17.7% year-to-year, according to the monthly data from the U.S. Department of Housing and Urban Development and the U.S. Census Bureau. According to the National Association of Home Builders (NAHB), higher mortgage rates that averaged 7.62% per Freddie Mac, the highest rate since 2000, depressed buyer demand and pushed down October’s sales. NAHB Chairman Alicia Huey, noting the interest rates, says new-home sales are not only up year-to-year, they’re also up 4.6% in 2023 so far “due to a lack of inventory in the resale market.” “Median new home prices have moved lower as new home size has decreased in 2023,” says NAHB Chief Economist Robert Dietz. “Combined with sales incentives and a lack of resale inventory, demand has remained solid in 2023 and should improve in 2024 as interest rates move lower.” A new home sale occurs when a sales contract is signed or a deposit is accepted. The home can be in any stage of construction: not yet started, under construction or completed. In addition to adjusting for seasonal effects, the October reading of 679,000 units is the number of homes that would sell if this pace continued for the next 12 months. New single-family home inventory in October increased to the highest level since January, up 8.3% from the previous month, to 439,000 – a 7.8-month supply at the current building pace. A measure near a 6-month supply is considered balanced. Of total inventory available to buyers, which includes new and existing homes, newly-built homes made up 30% of all single-family homes available for sale in October. Historically, new homes make up only 12%. The median new-home sale price in October was $409,300, down 3.1% from September, and down 17.6% year-to-year. Part of that drop is due to builder incentive use, though some stems from a trend to build smaller homes. According to NAHB, 33% of October sales were priced between $300,000 and $400,000; a year earlier, only 20% of sales were in that range. Regionally, on a year-to-date basis, new home sales were up 9.5% in the Northeast, 5.8% in the South and 2.5% in the West. In the Midwest, however, sales were down 0.3%. © 2023 Florida Realtors® 5 Fla. Metros Still Top U.S. Move-To HotspotsA Texas hotspot (Austin) lost residents for the first time, while Orlando, North Port-Sarasota, Tampa, Cape Coral and Miami made the top 10 for incoming residents. SEATTLE – About one-quarter (25.9%) of homebuyers looked to different part of the country in the third quarter of 2023, essentially flat from the record high of 26% in August. It’s up a bit from 24% a year ago and 19% before the pandemic. That data is based on about two million home searches conducted through Redfin’s website and covers more than 100 U.S. metro areas from July 2023 through September 2023. Overall, Florida’s metro areas remain strongly desired by buyers looking outside their current state, with five of the nation’s top 10 go-to metros. While overall demand has dropped some since the early days of the pandemic and work-from-home changes, the state continues to attract new residents, unlike some pandemic hotspots that have seen demand drop. Redfin’s latest report, for example, notes that once-hot Austin, Texas, has seen more residents planning to move out than in. Top 10 U.S. go-to metros areas in 3Q 2023
The drop in numbers for people considering out-of-state moves is less than the overall number of homebuyers seeking a move because affordability is a driving reason to relocate for many of them. Austin, Texas, had a notable fall. At the start of 2021, it was the top move-to metro in the nation, and the reasons for its decline may hold lessons for other metro areas. According to the study, Austin’s decline stems from a few issues:
Homebuyers leaving Austin are most commonly moving to other places in Texas. San Antonio and Corpus Christi are two of the three most popular destinations for Redfin.com users moving away from Austin; the other is Denver. © 2023 Florida Realtors® The Rough Buyers Market Still Great for SellersYears of soaring prices and a limited inventory of for-sale homes has stressed buyers for years, but today’s market remains a profit goldmine for most sellers. LOS ANGELES (AP) – Despite a housing slump going back more than a year, soaring home prices in recent years and a stubborn shortage of properties on the market are helping to drive solid profit gains for sellers. The profit margin on median-priced single-family homes and condos nationally soared to 59% in the July-September quarter, according to a report released Thursday by real estate information provider Attom. The profit margin in a home sale represents the percent difference between the original purchase price and what it was sold for. “Prices and profits around the U.S. got another boost over the summer as the housing market continued recovering from last year’s setbacks,” said Attom CEO Rob Barber. The third quarter increase followed profit margin gains of 56.6% in the April-June period and 55.2% in the January-March quarter. Even so, home sellers in the third quarter didn’t fare as well as in the same quarter last year, when the profit margin on a median-priced home was 62%, just below the all-time high on records going back to 2008. Home prices have remained resilient even as the housing market has slowed sharply under the weight of surging mortgage rates, which have held above 7% since August, crushing homebuyers’ purchasing power. The sharply higher home loan borrowing costs have discouraged many homeowners who locked in rates around 3% just two years ago from selling now, limiting the already near historic-low level of homes on the market. That, in turn, has stoked competition for fewer homes, keeping prices from falling significantly. The nationwide median home price rose 2% in the third quarter to an all-time high $350,000, according to Attom’s data. By some measures, home prices soared more than 40% during the pandemic as mortgage rates hit rock bottom, expanding how much homebuyers could afford to borrow. That led to bidding wars and homebuyers paying sometimes hundreds of thousands of dollars above the seller’s asking price. Many homeowners who bought their home before this superheated period in the market, are in the position to potentially reap a hefty profit margin should they sell now. And the longer they owned their home, the more the potential profit margin. Homeowners who sold in the third quarter had owned their homes an average of 7.86 years, which marked the second highest point since 2000, according to Attom. Still, when looking only at seller gross profits – not the profit margin – their gains are bit more modest. The median U.S. home sale gross profit in the third quarter was $129,900, a 3.2% gain compared to the same quarter last year and a 5% improvement since the second quarter, Attom found. Copyright 2023 The Associated Press. All rights reserved. This material may not be published, broadcast, rewritten or redistributed without permission. Fla. Sept. Report: Single-Family Sales Up 6.1%The increase breaks a pattern of declines, says Florida Realtors Chief Economist O’Connor, as prices rose 1.3%. For 3Q 2023, though, sales were down 3.2%. ORLANDO, Fla. – In September and the third quarter (3Q) of 2023, Florida’s housing market continued to show signs of stabilization in statewide median prices and improving inventory levels (active listings) compared to a year ago, according to Florida Realtors®’ latest housing data. “Florida continues to draw new residents, and the dollar volume of single-family home sales in September was up 14.1% year-over-year to $12.2 billion dollars,” says 2023 Florida Realtors® President G. Mike McGraw, a broker-associate with LPT Realty in Orlando. “Over that same timeframe, closed sales of single-family homes rose 6.1%. The Florida market remains strong in the face of higher mortgage rates, and first-time buyers are finding greater selections and less competition than they’ve seen in years.” September 2023: Last month, closed sales of existing single-family homes statewide totaled 21,335, up 6.1% year-over-year; existing condo-townhouse sales totaled 8,387, down 0.2% over September 2022, according to data from Florida Realtors Research Department in partnership with local Realtor boards/associations. 3Q 2023: Statewide existing single-family home sales totaled 66,450 for 3Q, down 3.2% from 3Q 2022. Statewide existing condo-townhouse sales totaled 26,129, down 5.8% year-over-year. Closed sales may occur from 30- to 90-plus days after sales contracts are written. Florida Realtors Chief Economist Dr. Brad O’Connor sees some increasingly positive signs as the market enters the fall season. “In September, closed sales of single-family homes were up for the first time compared to a year ago, rising by over 6%,” says O’Connor. “Closed sales of townhouses and condos in 2023 have been converging with their 2022 levels as well. We were still down in September year over year, but by a fraction of 1%.” While higher mortgage rates continue to challenge buyers, they’ve been rising “at a much slower pace than last year,” O’Connor adds. In September, the statewide median sales price for single-family existing homes was $409,243, up 1.3% from $403,880 one year earlier. For condo-townhouse units, the median price was $324,990, up 5.8% from $307,250 recorded in September 2022. In 3Q 2023, Florida’s single-family median sales price was $414,000, a 1.0% increase over the second quarter of 2022. The 3Q condo-townhouse median sales price was $320,545, a 5.8% year-over-year increase. The median is the midpoint; half the homes sold for more, half for less. “So far in 2023, new listings have been at their lowest level in several years, but in recent months, the level of new listings has been a little closer to pre-pandemic levels than it was earlier in the year,” says O’Connor. “In fact, new single-family listings in September exceeded the number of new listings in the same month in 2019 (pre-pandemic) for the first time this year. The same is also true if we compare this September’s new listings to those of last year, amounting to a year-over-year increase of 8%.” The end result, O’Connor says, is more active inventory at the end of September than at the beginning, and a slightly higher inventory of single-family homes year over year. However, he added, “Florida is still pretty far below the pre-pandemic level of inventory at this time in 2019.” On the supply side of the market, Florida had a 3.2-month supply of single-family existing homes in September, a 28% year-over-year increase. For condo-townhouse units, the state had a 4.1-month supply in September, for a 78.3% year-over-year increase. To see the full statewide housing activity reports, go to the Florida Realtors Newsroom and look under Latest Releases or download the September 2023 and 3Q 2023 data report PDFs under Market Data. © 2023 Florida Realtors® Single-Family Starts Up a Surprising 7% in Sept.Frustrated with the lack of existing-home inventory, more buyers turned to new construction in Sept. despite mortgage rates that topped 7%. WASHINGTON – Despite elevated mortgage rates averaging above 7%, single-family starts posted a solid gain in September as more buyers turned to builders after facing a dearth of inventory in the resale market. Overall housing starts increased 7% in September to a seasonally adjusted annual rate of 1.36 million units, according to a report from the U.S. Department of Housing and Urban Development and the U.S. Census Bureau. The September reading is the number of housing units builders would begin if development kept the same pace for 12 months. Within the overall number, single-family starts increased 3.2% to a 963,000 seasonally adjusted annual rate. For all of 2023, however, single-family starts are still lower year-to-year, down 12.8%. The multifamily sector, which includes apartment buildings and condos, increased 17.6% to an annualized 395,000 pace. Alicia Huey, chairman of the National Association of Home Builders (NAHB), calls the 7.6% uptick “somewhat unexpected … Our latest builder surveys indicate that starts are likely to weaken in the months ahead due to recent higher mortgage rates.” “Despite ongoing challenges in the market, the housing deficit of resale inventory continues to provide some market support for builders,” says NAHB Chief Economist Robert Dietz. “Because of a lack of existing homes in the marketplace, 31% of homes available for sale in August were new construction. This compares with a historical average in the 12-14% range. But in another sign that higher interest rates have slowed the market, the number of single-family homes under construction in September was 674,000, which is almost 15% lower than a year ago.” On a regional and year-to-date basis, combined single-family and multifamily starts are 23.3% lower in the Northeast, 12.9% lower in the Midwest, 7.8% lower in the South and 16.9% lower in the West. Overall permits – a sign of future home-start activity – decreased 4.4% to a 1.47 million unit annualized rate in September, though single-family permits increased 1.8% and multifamily permits decreased 14.3%. Looking at regional permit data on a year-to-date basis, permits are 22.3% lower in the Northeast, 16.6% lower in the Midwest, 12.7% lower in the South and 17.6% lower in the West. © 2023 Florida Realtors® 5 Fla. Metros in Top 10 for Out-of-State BuyersIn 2Q 2023, Fla. remained a top go-to state, with the lion’s share relocating from New York, but Chicago provided more buyers for Cape Coral, No. 7 on the list. SEATTLE – A record one-in-four national homebuyers (25.5%) searched for homes in metros outside their current state in the in the second quarter, up from 23% one year earlier, according to a report from Redfin. Before the pandemic, it was 19%. The total number of out-of-state-seeking buyers declined 7.5%, however the percentage grew because the number of people interested in in-state moves declined even more, down 18%. Of the top 10 states eyed for residency, Florida metros made up 50% of the top 10 go-to state metros. Tampa ranked highest at No. 3, and Las Vegas moved into the top spot based largely on the number of Los Angeles residents looking for a new out-of-state city to call home. Top 10 out-of-state metros in 2Q
Las Vegas topped Redfin’s list for the first time. The report notes that a typical Las Vegas home sells for $412,000, or less than half the price of a home in Los Angeles, and, “It’s a similar story for the other popular migration destinations, which include Phoenix, Sacramento and several Florida metros.” Of the top 10, nine have lower median sale prices than the top origin metro of buyers moving in. © 2023 Florida Realtors® NAR: June Pending Sales Rose 0.3%By Kerry Smith - July 27, 2023 WASHINGTON – Pending home sales registered a modest increase of 0.3% in June month-to-month – its first increase since February – according to the National Association of Realtors® (NAR). The South and West posted monthly losses, while sales in the Northeast and Midwest grew. All four U.S. regions saw year-over-year transaction declines. “The recovery has not taken place, but the housing recession is over,” says NAR Chief Economist Lawrence Yun, “The presence of multiple offers implies that housing demand is not being satisfied due to lack of supply. Homebuilders are ramping up production and hiring workers.” The Pending Home Sales Index (PHSI) – a forward-looking indicator of home sales based on contract signings – rose 0.3% to 76.8 in May. Year over year, pending transactions fell by 15.6%. An index of 100 is equal to the level of contract activity in 2001. Forecasting the future
NAR predicts the 30-year fixed mortgage rate will hit 6.4% before the end of this year and then decline a bit in 2024, dropping to 6.0%. It believes the unemployment rate will rise slightly to 3.7% this year and then increase to 4.1% in 2024. “With consumer price inflation calming close to the Federal Reserve’s desired conditions, mortgage rates look to have topped out,” Yun says. “Given the ongoing job additions, any meaningful decline in mortgage rates could lead to a rush of buyers later in the year and into the next.” NAR expects:
“It is critical to expand supply as much as possible to widen access to homebuying for more Americans,” Yun says. “Home prices will be influenced by how much inventory is brought to market. Increased homebuilding will tame price growth, while limited construction will lead to home price appreciation outpacing income growth.” Pending home sales regional breakdown:
© 2023 Florida Realtors® Lots of Fla. Cities ‘Best for First-Time Homebuyers’What makes a city “best” for first-timers? WalletHub looked at 22 key indicators, such as attractiveness, affordability and quality of life. Top of the list? Palm Bay. ORLANDO, Fla. – Not all first-time homebuyers are alike, and what they might find appealing can differ. But WalletHub looked at 300 U.S. cities and used “22 key indicators” to rank them. Those indicators include things like market attractiveness, affordability, quality of life, cost of living, real-estate taxes and property-crime rate. Florida cities, both large and small, ranked near the top for first-time homebuyers. Overall Florida metros in top 30 “Best Places for First-Time Homebuyers”
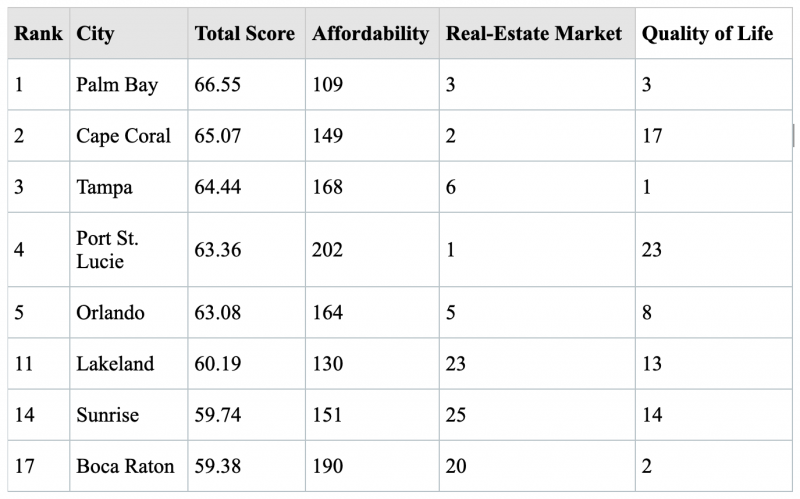
|
|||||||||||||||||||||||||||||||||||||||||||||||||||||||||||||||||||||||||||||||||||||||||||||||||||||||||||||||||||||||||||||||||||||||||||||||||||||||||||||||||||||||||
| Top 10 Metros Homebuyers Are Moving Into, by Net Inflow
Net inflow = Number of Redfin.com home searchers looking to move into a metro area, minus the number of searchers looking to leave |
|||||
| Rank | Metro* | Net Inflow, Q4 2022 | Net Inflow, Q4 2021 | Top Origin | Top Out-of-State Origin |
| 1 | Sacramento, CA | 5,700 | 6,600 | San Francisco, CA | Chicago, IL |
| 2 | Las Vegas, NV | 5,400 | 6,300 | Los Angeles, CA | Los Angeles, CA |
| 3 | Miami, FL | 5,300 | 9,500 | New York, NY | New York, NY |
| 4 | Tampa, FL | 4,000 | 6,500 | New York, NY | New York, NY |
| 5 | Phoenix, AZ | 4,000 | 8,400 | Los Angeles, CA | Los Angeles, CA |
| 6 | Dallas, TX | 3,400 | 6,700 | Los Angeles, CA | Los Angeles, CA |
| 7 | Cape Coral, FL | 3,300 | 4,700 | Chicago, IL | Chicago, IL |
| 8 | North Port-Sarasota, FL | 2,900 | 4,500 | Chicago, IL | Chicago, IL |
| 9 | Houston, TX | 2,800 | 2,100 | New York, NY | New York, NY |
| 10 | Orlando, FL | 2,800 | 1,000 | New York, NY | New York, NY |
| *Combined statistical areas with at least 500 users searching to and from the region in October-December 2022 | |||||
Homebuyers are leaving expensive coastal job centers
More homebuyers looked to leave San Francisco than any other metro in the fourth quarter, followed by Los Angeles and New York. The ranking of places homebuyers are moving away from is determined by net outflow, a measure of how many more people are looking to leave a metro than move in.
Washington, D.C. and Chicago round out the top five, followed by several other large northern job centers. Those are typically the places homebuyers looked to leave, as they tend to be expensive.
There are fewer homebuyers leaving most of those places than there a year earlier, reflecting the slow housing market. The net outflow from seven of the top 10 metros was smaller in the fourth quarter than a year earlier.
| Top 10 Metros Homebuyers Are Leaving, by Net Outflow
Net outflow = Number of Redfin.com home searchers looking to leave a metro area, minus the number of searchers looking to move in |
||||||
| Rank | Metro* | Net Outflow, Q4 2022 | Net Outflow, Q4 2021 | Portion of Local Users Searching Elsewhere | Top Destination | Top Out-of-State Destination |
| 1 | San Francisco, CA | 26,900 | 40,000 | 24% | Sacramento, CA | Seattle, WA |
| 2 | Los Angeles, CA | 23,100 | 32,000 | 20% | San Diego, CA | Las Vegas, NV |
| 3 | New York, NY | 17,600 | 19,300 | 27% | Miami, FL | Miami, FL |
| 4 | Washington, D.C. | 12,900 | 13,600 | 18% | Virginia Beach, VA | Virginia Beach, VA |
| 5 | Chicago, IL | 6,300 | 5,200 | 17% | Milwaukee, WI | Milwaukee, WI |
| 6 | Boston, MA | 4,900 | 8,000 | 18% | Portland, ME | Portland, ME |
| 7 | Denver, CO | 2,700 | 3,100 | 31% | Chicago, IL | Chicago, IL |
| 8 | Detroit, MI | 2,200 | 1,000 | 30% | Cleveland, OH | Cleveland, OH |
| 9 | Seattle, WA | 1,500 | 15,400 | 17% | Phoenix, AZ | Phoenix, AZ |
| 10 | Hartford, CT | 1,500 | 500 | 71% | Boston, MA | Boston, MA |
*Combined statistical areas with at least 500 users searching to and from the region in October-December 2022 |
||||||
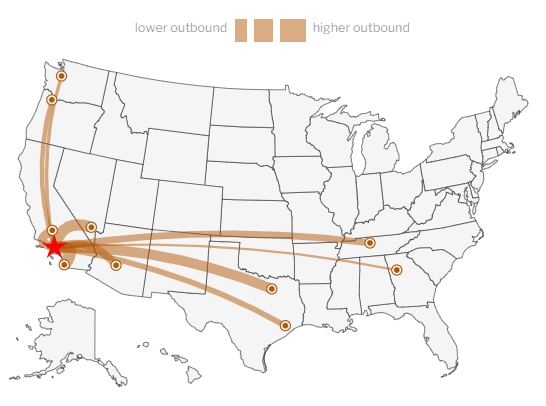
Below is a map of the most popular destinations for Redfin.com users who are leaving the Los Angeles metro. To view similar maps for the metros in this report and other metros, please visit the area’s Redfin housing market page and scroll down to the “migration” section.
Methodology
Our migration analysis is based on about two million Redfin.com users who viewed for-sale homes online across more than 100 metro areas from October 2022 to December 2022. To measure the share of homebuyers looking to relocate from one metro to another, we calculate the portion of overall home searchers that are migrants.
A Redfin.com user counts as a migrant if they viewed at least 10 for-sale homes in the third quarter and at least one of those homes was outside their home metro area. For instance, if a Redfin.com user based in Seattle views 10 homes in a three-month period and all of them are in Phoenix, that user counts as a full migrant to Phoenix. If a user based in Seattle views 10 homes in a three-month period and five are in Phoenix but five are in San Diego, that user counts as half of a migrant to Phoenix and half of a migrant to San Diego. If a user based in Seattle views 10 homes in a three-month period, nine in Seattle and one in Phoenix, that user counts as one-tenth of a migrant to Phoenix.
The analysis includes combined statistical areas with at least 500 Redfin.com users based in that region and at least 500 users searching for homes in that region. For instance, a user based in Seattle searching for a home in Phoenix counts toward the first condition, a user based in Phoenix searching for a home in Seattle counts toward the second condition, and a user based in Seattle searching for a home in Seattle counts toward both. Redfin’s migration data goes back to 2017.
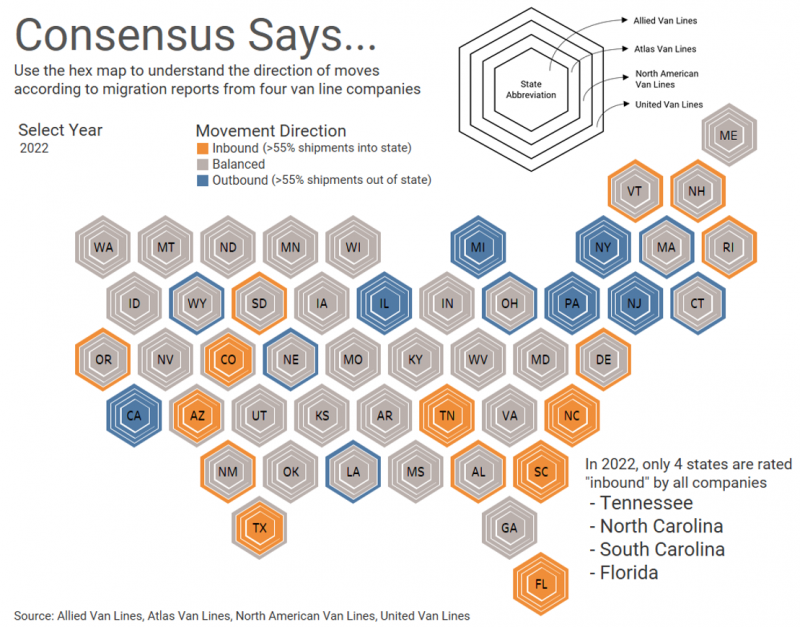
Migration hits a new high, with Florida a top destination
New data from Redfin finds a record percentage of people are looking to move to another metro area, with affordability playing a bigger role.

Dave Gallagher
Key points:
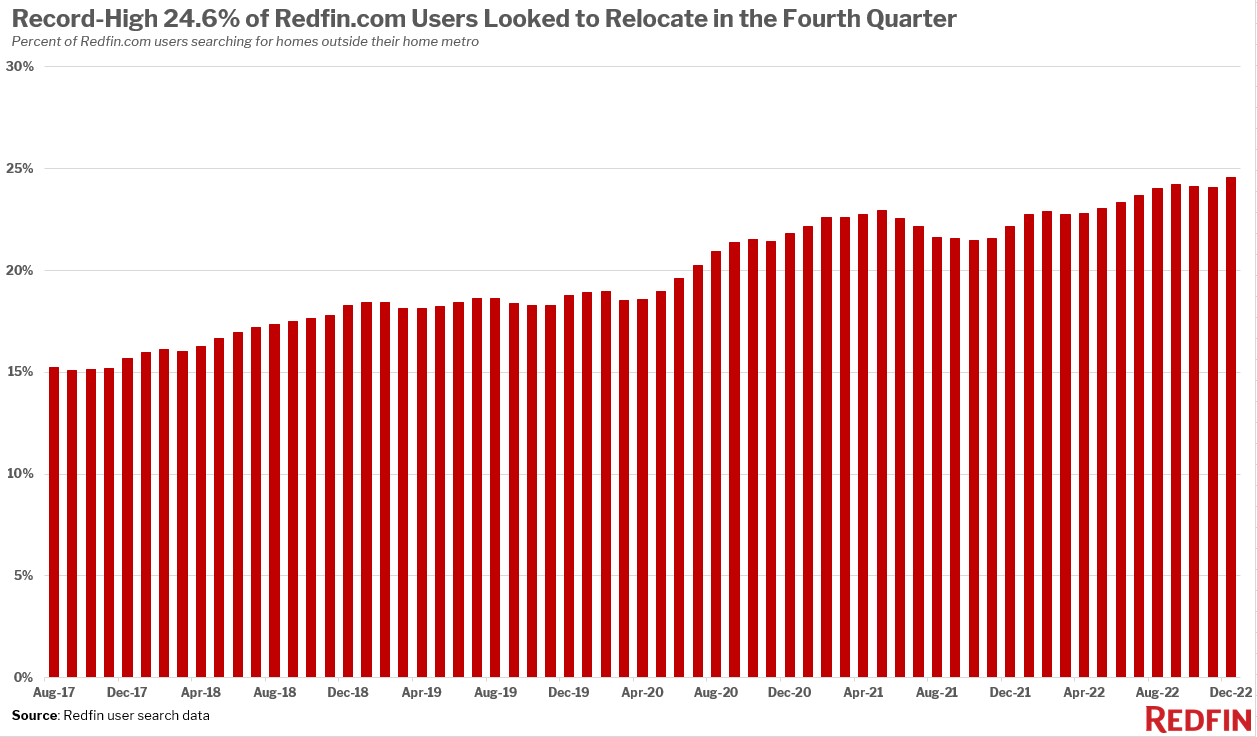
- 24.6% of Redfin users were looking to move to another area in the fourth quarter.
- Sacramento was the most-searched city, but Florida was a popular destination, with five metro areas landing in the top 10.
- Expensive coastal cities topped the list of areas Redfin users were looking to move away from.
Movers are looking for Florida sunshine — and affordable homes.
The latest Redfin migration report found that nearly a quarter of its users were looking to move to a different metro area in the fourth quarter of 2022 — that’s more users than at any time during the pandemic, and a record number since the company began tracking the data.
While factors like remote work are still likely in play, affordability has become a more pressing issue. The report found most of the searches targeted more affordable areas that didn’t experience a big spike in home prices earlier in the pandemic.
Based on search volume, the most popular cities for would-be movers were Sacramento, Las Vegas and Miami. At the other end of the spectrum, San Francisco, Los Angeles and New York City had the highest number of users looking to move away.
Sacramento, along with some other cities on the list, has seen prices surge, but Redfin noted that it is still more affordable than the nearby overheated metro areas of San Francisco and San Jose.
Florida continues to have strong appeal, with five metro areas (Miami, Tampa, Cape Coral, Sarasota and Orlando) landing in the top 10 of most-searched areas among buyers who live outside those metros. Florida has consistently topped similar types of lists from other organizations that measured migration in 2022.
The report noted that overall, the number of people looking to move is down, reflecting the slower market. Eight out of the 10 migration destinations had fewer homebuyers looking compared with the previous year, according to the report.
However, those who want to move are more likely than ever to look at other metro areas. The 24.6% of users looking to move to another area in the fourth quarter is up from 22.1% a year earlier and around 18% before the pandemic.
While migration was especially high in the fourth quarter, the trend of moving to more affordable metro areas has been ongoing throughout the pandemic, even when the market was hot, according to data from Freddie Mac.
“The pandemic amplified existing urban de-concentration by threefold from large, expensive metro areas to smaller, more affordable destinations,” according to the Freddie Mac report.
More people may be willing to move in pursuit of affordability — but that doesn’t mean they’ll find a homebuying bargain. A recent affordability report from ATTOM found that in 95% of the largest markets analyzed, it was currently a better deal to rent than to buy, a reversal from a year ago.
Rick Sharga, executive vice president of market intelligence for ATTOM, noted that monthly payments for new homeowners rose around 50% in many markets, making renting a better option even as those payments have also risen.
Even some affordable markets for buyers continue to experience more outflow than inflow. Detroit, for example, where median sale prices are well below national levels at around $72,000 according to Redfin, had double the amount of outflow searches in the fourth quarter of 2022 compared to a year earlier. The most popular city searched for by users in Detroit was nearby Cleveland, where the median sale price is an affordable $115,000.
Fla. Top State for 2022 Home Value Increases
Analysis finds Fla. home prices rose 17.27% last year, the most in the U.S., with Vermont second at 15.15%. But in last-place Idaho, values sank 0.18%.
TAMPA, Fla. – Florida home values rose more in 2022 than in any other state, according to data analyzed from real estate company, Zillow.
The average value of a Florida home, per the most recent publicly available data measured in December 2022, was just under $405,000 – That’s up more than $56,000 from $345,305 in January 2022.
The 17.27% change in value outpaced every other state in the nation.
Vermont was the runner-up, with home values rising an estimated 15.15% in the 12-month timeframe. The average value of a home there was estimated to be $386,000.
The state with the highest value homes was recorded in Hawaii, where the average value was $902,175 in December 2022 – up 9.63% from $822,924 in January 2022.
On the opposite end of the spectrum was Idaho, where home values actually fell 0.18%, or by $825, since January 2022. The average home value was $459,947 in December.
“The housing market has indeed been turbulent over the past few years, with house prices being affected by inflation, the pandemic and many more factors,” a spokesperson from Santa Monica Realtors said. “This study provides a fascinating insight into which parts of America have seen the highest increases as well as the lowest.”
The housing crisis facing America is particularly acute in Florida. Researchers at Florida Atlantic University study the price of housing across the country and in the Sunshine State. The data from FAU and Florida International University, called the Beracha and Johnson Index, analyzes home prices by comparing their expected prices and list prices.
As recently as December, FAU reported that five Florida real estate markets were among the most overpriced in the country.
“We hear how slow the U.S. housing market is,” Ken H. Johnson, Ph.D., a real estate economist in FAU’s College of Business, said, “but consumers are still buying and selling, and that activity is keeping prices elevated in a lot of metro areas.”
The Beracha and Johnson Index does not consider historical market prices when showing rankings of value versus list price, according to FAU. However, even the researchers behind the Index say the prices in Florida will likely stay higher, as other markets decline.
FAU and FIU said in December that Florida markets like North Port and Cape Coral were starting to go down in price for the first time since their markets peaked, but that Florida prices remained elevated.
“It is hard to say where prices will go from here in Florida,” said Eli Beracha, Ph.D., of FIU’s Hollo School of Real Estate. “But it seems most likely that Florida housing markets will fare better than most other markets across the country due to the persistent shortage of homes for sale and the pace at which people are relocating to the state.”
While the real estate trends remain in flux, AgentStory, a tech real estate company, has focused on measuring how many real estate agents are actively engaged in the market.
Their proprietary end-of-year data for 2022 showed fewer agents were active at the end of 2022 than at the end of 2021, down roughly 6.5% in the Tampa area. Additionally, AgentStory said quarter-to-quarter, the data tells a different story than just looking at changes year-over-year.
While companies like Zillow or Redfin measure the market by list price and mortgage rates, AgentStory bases their analysis on multiple listing service data instead. Their data is also made up of averages rather than medians.
“According to the Tampa report, in Q4 2022, there were 2188 active agents and in Q4 2021 there were 2339. So the difference is -6.5%,” AgentStory told WFLA.com. “The annual comparison hides the fact that the first half of 2022 was strong and then dropped.”
Looking at listing data, AgentStory reported that Tampa area homes spent twice as long on the market in Q4 2022, compared to Q4 2021, for 34 days on the market compared to 17 days the year before.
Turning to the housing market more broadly, the reported rate for a 30-year-fixed rate mortgage is currently 6.15%, according to Freddie Mac, a federally-backed mortgage company. Freddie Mac reports the rates every Thursday. The new rate reported Thursday is the second week in a row with a decrease in level.
“As inflation continues to moderate, mortgage rates declined again this week,” Sam Khater, Freddie Mac’s chief economist, said. “Rates are at their lowest level since September of last year, boosting both homebuyer demand and homebuilder sentiment. Declining rates are providing a much-needed boost to the housing market, but the supply of homes remains a persistent concern.”
© 2023 WFLA, Nexstar Broadcasting, Inc. All rights reserved.
Real Estate Trends: What’s the 2023 Fla. Outlook?
Florida Realtors chief economist: Expect Fla. housing to return to a more “traditional” market like in 2018-2019 “as supply and demand become more balanced.”
ORLANDO, Fla. – What should consumers, Realtors® and policymakers expect when it comes to Florida real estate over the next year? After the unexpectedly strong years of 2020 and 2021 despite an ongoing pandemic, Florida’s housing sector in 2022 was affected by rapidly rising inflation and higher mortgage interest rates, Florida Realtors® Chief Economist Dr. Brad O’Connor told nearly 500 Realtors during the 2023 Florida Real Estate Trends summit last Thursday.
“Now, we expect the state’s residential real estate market to return to a more typical pace,” he said. “I believe 2023 will look more like the ‘traditional’ housing market years of 2018-2019 in Florida as supply and demand become more balanced.”
The event was part of this year’s Florida Realtors’ Mid-Winter Business Meetings at the Renaissance SeaWorld Orlando. In addition to O’Connor, the summit featured John Leer, chief economist of Morning Consult, which uses high-frequency survey data to capture insights into consumer attitudes and concerns. Leer leads global economic research and oversees the firm’s economic data collection, validation and analysis. He is an authority on the effects of consumer preference, expectations and experiences on purchasing patterns, prices and employment.
It also included a panel of Realtors who use Florida Realtors’ SunStats resource regularly, sharing how it helps them in their business. Panelists were Peter West, broker/managing partner, Bishop West Real Estate; Kara Wisely, broker associate, Berkshire Hathaway HomeServices Florida Realty; and John J. Adams, president, Adams, Cameron and Co., Realtors. Jennifer Warner, Florida Realtors economist and director of economic development, served as the moderator.
Dr. Brad O’Connor, Florida Realtors chief economist
One major question currently on the minds of real estate professionals, homebuyers, home sellers and others: Is a price correction on the way?
“Prices are determined by both demand and supply,” O’Connor said. “Falling demand is only one ingredient needed for a large correction; we also need a flood of supply. In the last housing cycle, this came from overbuilding and foreclosures. And it’s unlikely that we’re going to see a flood of newly built homes on the market for several reasons. First, fewer homebuilders currently exist than in years past; builders are more conservative when it comes to taking on new builds; and home builds are taking longer to complete. Supply is also being affected by homeowners who don’t want to list their house and buy a different one because they’re likely to have to pay more on the next home due to higher mortgage interest rates.
“So it’s true some owners are feeling ‘locked-in’ to their current home and current mortgage rate, but it’s not all homeowners. We are seeing gains in inventory (active listings) and closed sales are continuing. And we are going to see some relaxing or easing in prices – but we’re not going to see a great drop unless or until we see more supply available.”
According to O’Connor, inflation will continue to be a factor in 2023, though recent economic news shows the Federal Reserve’s action to fight inflation appears to be having a positive effect. Buyer demand in Florida in the coming months will continue to be challenged by insurance costs, mortgage rates – especially if rates start rising again to 7% or higher – and ongoing economic uncertainty that erodes consumer confidence.
“Mortgage rates will come down, but it’s all dependent on different factors,” he said. “All of the current forecasts on existing home sales in 2023 rely on where the 30-year mortgage rate is going to be, and that’s in flux.
Recent 2023 forecasts for U.S. existing home sales compared year-over-year to 2022 include:
- National Association of Realtors® (12/13/22): Existing home sales fall 7.0% Y/Y in 2023
- Fannie Mae (12/12/22): Existing home sales fall 21.1% Y/Y in 2023
- Mortgage Bankers Association (12/19/22): Existing home sales fall 13.7% Y/Y in 2023
- Redfin (12/6/22): Existing home sales fall 16.0% Y/Y in 2023
- Realtor.com (11/30/22): Existing home sales fall 14.1% Y/Y in 2023
- National Association of Home Builders (1/4/23): Existing home sales fall 15.7% Y/Y in 2023
O’Connor said, “In the first half of this year, I feel confident that we’re going to see home prices flatten out on average, and I think sales will kind of hug below the line of 2018 (closed existing home sales). I expect closed sales to hover a bit below the more usual pace of Florida home sales, such as what we saw in 2018. However, because home prices are much higher now than in 2018, we are still going to see a higher dollar volume of closed existing home sales, just not at the level of last year or in 2021 with dollar volume.”
Dr. John Leer, Morning Consult chief economist
How consumers are affected by the economy, inflation and other factors – or how they feel about what’s going on in the world around them – influences consumer confidence and factors into their buying decisions or saving habits, according to Dr. John Leer, chief economist for Morning Consult.
“In 2023, consumer confidence is starting to rise across most of the U.S. but remains far off from where it was a year ago,” he said. “It’s going to take a prolonged period of real wage growth and fairly stable policy outcomes for consumers to feel more comfortable and confident about the economy and their future. In December, consumers reported rising credit balances at the highest rates since tracking began. Research shows more consumers are finding it difficult to make ends meet at the end of the month, and the share of adults able to save each month continues to shrink.”
Leer pointed out this is a sign that consumers have been pushed to the brink and are having to pull back on spending as higher expenses erode their savings and sense of financial stability.
“While we’re seeing in the news that inflation is starting to cool, inflation is still impacting consumers,” he said. “They still feel and see that inflation is costing them more. Consumers are under financial stress and they’re trying to downsize their spending. Over the last two months, what we’re seeing is the outlook for the U.S. economy has really deteriorated, particularly among consumer fronts. Consumers have exhausted their sources of spending. We expect to see consumers continue to draw back from spending as small business and other sectors reduce hiring, expenditures and otherwise also contract.”
However, Leer also noted that housing and homeownership remain a top priority for many consumers.
“Housing prices are beginning to flatten but continue to resist declines as buyer interest perks up,” he said. “Buyers are still waiting in the wings, interested in purchasing a home as soon as they’re able to do so financially. We continue to see that homeownership remains a strong goal for consumers, particularly for young adults looking to start a family and who feel secure in their jobs and ready for that next transition.”
© 2023 Florida Realtors®
Interest Rates, Inflation Impact Fla.’s 2022 Housing Market
January 20, 2023
Florida Realtors data: But for-sale inventory rose and median sales prices up year-over-year. Single-family homes up 15.7% to $402,500; condos up 21.6% to $306,500.
ORLANDO, Fla. – As 2022 ended, Florida’s housing market looked similar to the more traditional market years prior to the pandemic in terms of total closed sales, though it fell short in the year-to-year compared to the unusually strong 2021 sales. The statewide inventory of for-sale existing homes and condo properties showed gains while statewide median sales prices continued to rise year-over-year, despite headwinds from inflation and higher interest rates, according to the latest housing data released by Florida Realtors®.
Year End 2022
Florida Realtors® Chief Economist Dr. Brad O’Connor pointed out that in 2021, Florida’s housing market was “on a sugar high. Overall, closed sales in 2022 were pretty good when you look at the more ‘traditional’ housing market years of 2018 and 2019.”
At the end of 2022, statewide closed sales of existing single-family homes totaled 287,352, down 18% compared to the 2021 year-end level, according to data from Florida Realtors’ research department in partnership with local Realtor boards/associations. Closed sales may occur from 30- to 90-plus days after sales contracts are written.
The statewide median sales price for single-family existing homes at year’s end was $402,500, up 15.7% from the previous year. The median is the midpoint; half the homes sold for more, half for less.
Looking at Florida’s year-to-year comparison for sales of condo-townhouses, a total of 125,494 units sold statewide in 2022, down 21.7% compared to 2021. The statewide median price for condo-townhouse properties at the end of the year was $306,500, up 21.6% from the previous year.
Statewide, the median percentage of the original listing price received by sellers at the end of 2022 continued at about the same level year-over-year in both property type categories at 100% for single-family existing homes and at 99.9% for condo and townhouse units.
According to Florida Realtors’ data, at the end of 2022, in December 2022 and also in 4Q 2022, inventory (active listings) for single-family homes stood at a 2.7-months’ supply, while inventory for condo-townhouse properties was at a 2.8-months’ supply.
“The good news is, we have a lot more inventory than what we had over the pandemic years,” O’Connor said. “Active listings of single-family existing homes more than doubled from a 1-month supply at the end of 2021 to a 2.7-months’ supply at the end of 2022. If we get a little relief in mortgage rates, then all the other factors are still there that make Florida appealing and a strong draw for buyer demand.”
December 2022
In December, closed sales of single-family homes statewide totaled 19,158, down 36.1% from December 2021, while existing condo-townhouse sales totaled 7,677, down 40% year-over-year, according to Florida Realtors’ data.
The statewide median sales prices for both existing single-family homes and condo-townhouse properties rose year-over-year in December 2022. The statewide median sales price for single-family existing homes was $395,000, up 5.6% from the previous year. Meanwhile, the statewide median price for condo-townhouse units was $310,000, up 8.8% over the year-ago figure.
4Q 2022
Statewide closed sales of existing single-family homes totaled 57,004 in the fourth quarter of 2022, down 33.1% compared to the previous-year figure, according to Florida Realtors’ data. The statewide median sales price for existing single-family homes for 4Q 2022 was $400,000, up 9.6% from 4Q 2021.
Looking at Florida’s year-to-year comparison for sales of condo-townhouses in 4Q 2022, a total of 23,117 units sold statewide, down 35.5% from the same quarter in 2021. The statewide median price for condo-townhouse properties for the quarter was $310,000, up 14% over the previous year.
Looking ahead in 2023, Chief Economist O’Connor said mortgage rates – and the Federal Reserve’s action on interest rates as it continues to fight inflation – will influence ongoing market conditions.
He said, “Over the next six months, if mortgage rates don’t rise and return to 7%, that would help encourage buyers – and I think we’ll see mortgage rates stay just above 6% for a while. If we keep seeing more good news on the economic front, then I think we’ll see the housing market respond. Buyer demand is there, perhaps waiting on easing home prices, more supply and other factors.”
To see the full statewide housing activity reports, go to the Florida Realtors’ Newsroom and look under Latest Releases or download the December, 4Q or Year End 2022 data report PDFs under Market Data on the site.
© 2023 Florida Realtors®
Forbes: Top 10 Best-Places-to-Live Fla. Metros
Miami was “most vibrant” and Orlando “most prominent,” but Tampa ranked No. 1 on the top-10 list as “a destination for people looking to change up their scene.”
TAMPA, Fla. – A new listing of the best places to live in Florida by Forbes Advisor put Tampa at No. 1. Citing positive attractions for young adults and families, as well as “pristine beaches,” Tampa was the best place to live in the Sunshine State.
The Forbes analysis of which cities were Florida’s best examined things to do, median home prices, median salaries, crime levels, and population sizes, to name a few.
While Miami was named the “most vibrant” and Orlando was “most prominent,” according to Forbes, Tampa had the right mix of museums, sports teams, job opportunities, tourism, and a commitment to the arts.
The area has also seen a big move for businesses coming to the area, making it more of a destination for those looking to change up their scene. In addition to the new businesses and new job opportunities, Tampa is also in a drivable zone to get to other popular cities with different attractions, like Orlando or Miami.
“Tampa has also experienced an influx of employers across several industries ranging from advanced manufacturing to financial services and life sciences. Tourism and MacDill Air Force Base also play a pivotal role,” Forbes said. “While Tampa offers everything you need for daily life, Orlando is also a two-hour drive and Miami is only four hours away.”
While home values are relatively higher than some of the other cities on the list, Tampa’s median income of $55,600 and low unemployment rate put it above places like Gainesville, Orlando, and even Miami. Compared to Tampa, Miami had a lower median income and higher median home prices, in addition to a higher cost for monthly expenses.
Forbes Advisor top 10 for Florida’s best places to live
- Tampa
- Jacksonville
- Gainesville
- Cape Coral
- Orlando
- Miami
- Melbourne
- Sarasota
- Tallahassee
- Pensacola
© 1998-2023 WKRG, Nexstar Broadcasting, Inc. All rights reserved.
S. Fla. in 2023: What Can Buyers, Sellers Expect?
Home prices will likely remain high and even increase, but at a much slower pace. The year will probably see fewer sales and a growing inventory of for-sale homes.
FORT LAUDERDALE, Fla. – After an unexpected slowdown in the South Florida housing market this year, what does 2023 hold for buyers and sellers? The South Florida Sun Sentinel talked to the experts on what people can expect in the coming year with mortgage rates, if buyers will have more choices, if homes might be easier to get and if prices will ever come down.
Here’s what they say.
Home prices remain high, but growth will be slower
Experts believe that for the most part, home prices in South Florida will increase, but at a slower pace as the market continues to stabilize after the record two years it had during its pandemic boom.
“I expect prices will be stable, maybe slightly downward over the first few months of the year. Toward the second part of the year, interest rates should be easing and convincing some buyers to return to the market, so prices will go back up,” said Eli Beracha, director of Florida International University’s Hollo School of Real Estate. “We’re probably looking at a moderate price appreciation overall.”
It’s hard to put an exact number on how much prices will appreciate. The current median sale price for a single-family home in the tri-county area is about $475,000, a 12% increase from the year before, according to data from Redfin.
Realtor.com predicts that home prices in South Florida will grow by about 3.4% next year, while CoreLogic suggests that the average price growth for single-family homes will be about 8%. Zillow predicts that home prices will grow about 1% next year.
Affordability will remain an issue for many buyers as a lack of available land to build on and demand for out-of-state buyers will help keep prices high.
“The prices of single-family homes is going to continue to appreciate in 2023 because of the amount of people moving here and the limited inventory for sale,” said Craig Studnicky, co-founder and CEO of ISG WORLD and RelatedISG Realty. “Prior to COVID, I maybe sold to one California buyer a year, now we are doing about two a week. It’s the same with New York; the northeast is shrinking.”
Where will mortgage rates go?
Mortgage rates remain a key issue for both buyers and sellers, as both groups wait to see how mortgage rates fare in the new year.
Rates have started to drop down from the record highs of upward of 7% in the fall as the Federal Reserve signaled that it might take a less aggressive approach in trying to cool inflation. The average on the 30-year rate recently dipped to 6.27%, according to mortgage buyer Freddie Mac.
Forecasts vary on where mortgage rates might be: A Freddie Mac forecast put mortgage rates at around 6% for most of the year, still almost double than the pandemic lows that drew in a lot of buyers. The higher mortgages are, the less buying power buyers have, especially ones purchasing their first home.
“It’s been challenging with prices going up, and rates have reduced the amount they can look at to buy a home,” said Craig Garcia, Capital Partners Mortgage. “It’s definitely easier because there is less competition and more chances for a buyer to negotiate with sellers for some type of concession.”
It’s hard to predict exactly where rates might be, but there are two key indicators to watch for, Garcia said.
“It’s really two pieces of the puzzle that are the most important – the economic growth situation and the inflation,” he said. “If the economy looks like it’s strong and inflation is still not under control, we will likely have higher rates, and rates will continue to climb.”
More homes, less sales
Inventory levels are also expected to rise in the new year, giving buyers a little bit more flexibility in what they can choose from and building on the slight increase of homes coming to the market over the past few months.
There could be a 10% increase in inventory, noted Patty DaSilva, broker with Green Realty Properties in Cooper City, leading to less competition among buyers.
“Now we are seeing a few multiple-offer situations, or maybe a buyer offering $5,000 over asking,” DaSilva said. “It’s not like what we were seeing before where a buyer might offer $175,000 over asking or a property had 39 offers. It’s much more reasonable and properties have to be priced correctly. “
On the flip side, it’s likely that there will be fewer overall transactions in the beginning of the year, mainly due to high mortgage rates keeping homeowners in their current homes.
“Interest rates are still high and those who don’t have to move won’t because they’ll end up paying off a house at a lower interest rate and buying at a higher one,” Beracha said.
New projects on the market
Despite some homes coming to the market, overall supply will still be constrained, as supply chain issues, uncertainty about interest rates, and the cost of creating will put a damper on new projects from developers.
“I think you are going to see a slow number of starts in construction in the new year,” said Ignacio Diaz, developer with Group P6. “The overall financial costs are very high, so it’s a lot of headwind to start new projects.”
A few factors are making it more difficult to get new projects off the ground: the lack of available land in South Florida, the uncertainty of where interest rates will be and how it affects construction loans, and the cost of insurance.
“Because the interest-rate environment has changed drastically, some of the projects, they just don’t work with the current rate of construction loans as well as the valuation of these projects,” said Harvey Hernandez of Newgard Development Group.
Developers expect that many projects will be shelved and re-evaluated in 2024 and 2025. This will keep upward pressures on prices, and contribute further to the severe lack of housing in the area.
“A lot of projects are going to be shelved in the hopes that interest rates will come down,” said Chad Moss with MFO Worldwide.
© 2022 South Florida Sun-Sentinel. Visit sun-sentinel.com. Distributed by Tribune Content Agency, LLC.
New Year’s Resolution: Invest in Real Estate
December 20, 2022
Stocks mainly pay when they appreciate and bonds via coupons, but real estate offers five profit centers, such as income, tax savings and principal paydown.
NEW YORK – If you invest in stocks or bonds, you may be more accustomed to one way of getting paid. For stocks, typically you’ll only get paid from stock price appreciation. For bonds, you’ll typically only get paid from the coupon payments (similar to net rental income of rental properties).
Since 2000, government bond yields have averaged 2-4%, while corporate bonds have averaged 4-6%. Bonds can also appreciate and depreciate in price if the investor sells before maturity.
In comparison, let’s take a look at the five profit centers in real estate investing and how they can impact your long-term investment strategy:
- Net rental income: This is the money you make after all expenses (mortgage, insurance, property management fees) are deducted from your monthly rental income.
- Tax savings: When you invest in real estate, you can take advantage of numerous tax deductions and write-offs. This can help you save a lot of money come tax time!
- Principal paydown: Every month, a portion of your mortgage payment goes towards paying down your balance, paid by your renter. This is a great way to build equity in your property and reduce your overall mortgage balance.
- Home price appreciation: Over time, the value of your property is likely to increase. This can provide you with a nice return on investment when you refinance or sell the property. Out of all of the profit centers, home price appreciation will have the greatest impact on return on investment over a full market cycle (10-20 years.)
- Inflation hedging: When inflation goes up, the prices of goods and services also increase. But since your mortgage payments remain the same, your purchasing power actually goes up! This makes real estate a great hedge against inflationary pressures.
© Copyright © 2022 Financial News & Daily Record, All rights reserved.
Report: Florida Will Need 570K Housing Units by 2030
The great weather, paired with the "work-from-anywhere" dynamic brought about by the pandemic, continues to bring more people to the Sunshine State, according to the FAA.
The Florida Apartment Association (FAA) has launched a new website, BuildFlorida2030.com, that tracks the state's growing housing needs and includes a dashboard that tracks the percentage of renters, as well as a breakdown of land and construction costs by county.
"I think the big key takeaway is that Florida ... has been growing at a tremendous rate over the past decade or so," said Amanda White with the FAA. "Between 2010 and 2020 for example, the state grew by 15%, which amounts to 2.7 million people, (and) rank(s) second overall (in-state growth) after Texas."
According to the data, the Orlando-Kissimmee-Sanford metro area has a shortage of 10,000 apartment units.
By 2030, Florida's population is projected to grow by 3.2 million, which means the state needs 570,000 housing units by then.
“I think the pandemic really changed the dynamic and people are able to work from anywhere and I think a lot of states in the Sunbelt like Florida that have great weather, beautiful, natural resources and beaches and things of that nature, I think it really attracted folks to live where they want to live,” White said.
Source: "Florida will need 500K housing units by 2030 with growing population, experts say," ClickOrlando.com
Fla. Has 5 of Top 10 Move-To Metros in U.S.
Fla. metros remain popular with outside-the-city homebuyers. In a 3Q top-state popularity contest, Fla. has 5 metros in the top 10 and Calif. has 2.
SEATTLE – About one in four (24.1%) U.S. homebuyers considered moving to a different metro area in third quarter of 2022, according to a report from Redfin, and five of the popular metros in the top 10 were in Florida.
Top U.S. metro areas by inflow in 3Q
- Sacramento, California: Top origin metro, San Francisco. Top out-of-state origin: Chicago
- Las Vega, Nevada: Top origin metro, Los Angeles. Top out-of-state origin: Los Angeles
- Miami: Top origin metro, New York. Top out-of-state origin: New York
- San Diego, California: Top origin metro, Los Angeles. Top out-of-state origin: Chicago
- Tampa: Top origin metro, New York. Top out-of-state origin: New York
- Phoenix, Arizona: Top origin metro, Los Angeles. Top out-of-state origin: Los Angeles
- Cape Coral, Florida: Top origin metro, Chicago. Top out-of-state origin: Chicago
- North Port-Sarasota, Florida: Top origin metro, Chicago. Top out-of-state origin: Chicago
- Dallas, Texas: Top origin metro, Los Angeles. Top out-of-state origin: Los Angeles
- Orlando, Florida: Top origin metro, New York. Top out-of-state origin: New York
The third quarter results were similar to the second quarter, according to the study, but up from 2019 when 18% of home shoppers searched for housing in a different metro area.
The U.S. housing market cooled significantly during the second half of 2022, but of the people still buying homes, an unprecedented portion are relocating to new metros. Many are seeking relative affordability as mortgage rates hover around 7% and persistently high home prices make expensive parts of the country even more expensive.
Overall, affordable Sun Belt metros are most popular with relocating homebuyers, largely because they can get more home for less money. In Las Vegas, for instance, the typical home cost $410,000 in October, roughly half the price of the typical home in Los Angeles ($823,000) – the most common origin for people moving there.
Buyers leaving expensive West Coast, East Coast cities
More homebuyers looked to leave San Francisco, Los Angeles, New York, Washington, D.C. and Boston than other major metros, determined by net outflow – a measure of how many more Redfin.com users looked to leave an area than move in.
In general, homebuyers are leaving expensive coastal job centers more than other places – a trend that started before the pandemic and picked up steam due to remote work and rising housing costs – and they commonly head to more affordable regions.
© 2022 Florida Realtors®
Reprinted with permission. Florida Realtors®. All rights reserved.